|
l
o o m 2
|
||||||||||||||||
|
w
o r k i n p r
o g r e s s
|
||||||||||||||||
|
professor
judith donath . danah boyd . hyun-yeul lee . dan ramage
w/ support from scott golder . ming-en cho . jonathan goler |
||||||||||||||||
|
|
||||||||||||||||
| |
||||||||||||||||
|
The following show approaches we are taking to try to understand the data available in Usenet. |
||||||||||||||||
 |
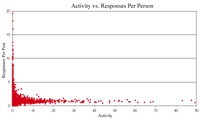
Understanding activity. This selection of graphs illustrates some of the information we uncovered when trying to understand one's level of activity. | |||||||||||||||
 |
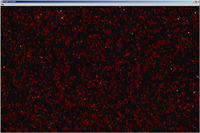
Visualizing activity. These pieces show similar information to the above, but in a more artistic manner, allowing us to get a general sense of the environment, without focusing on the details. | |||||||||||||||